Custom Dashboards allow users to create personalized views of their business data using interactive charts, KPI cards, and tables. Whether you want to track application pipelines, monitor team productivity, analyze revenue trends, or measure marketing campaign performance, custom dashboards help you visualize the information that matters most.
This guide explains how to create, customize, and manage dashboards in Agentcis.
Note: Custom Dashboards are available exclusively to users on the Premium Plan. Users must have the appropriate dashboard permissions to create and manage dashboards.
To create a new dashboard, follow these steps:
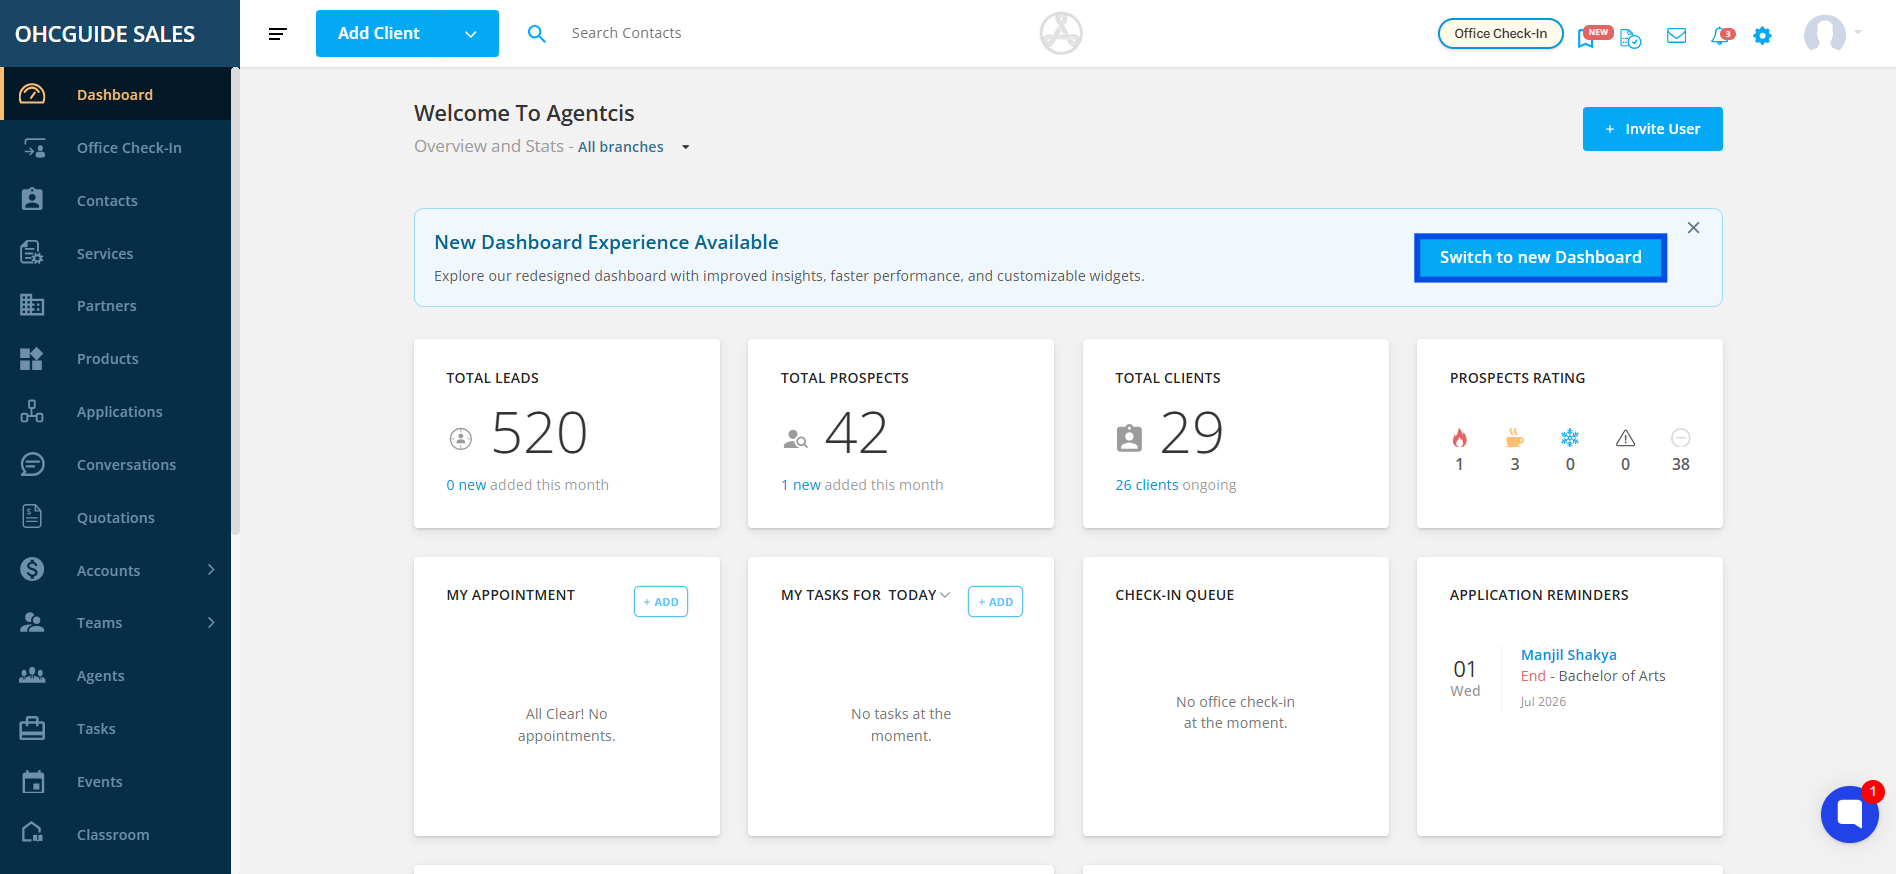
Navigate to New Dashboard by clicking switch to new dashboard.
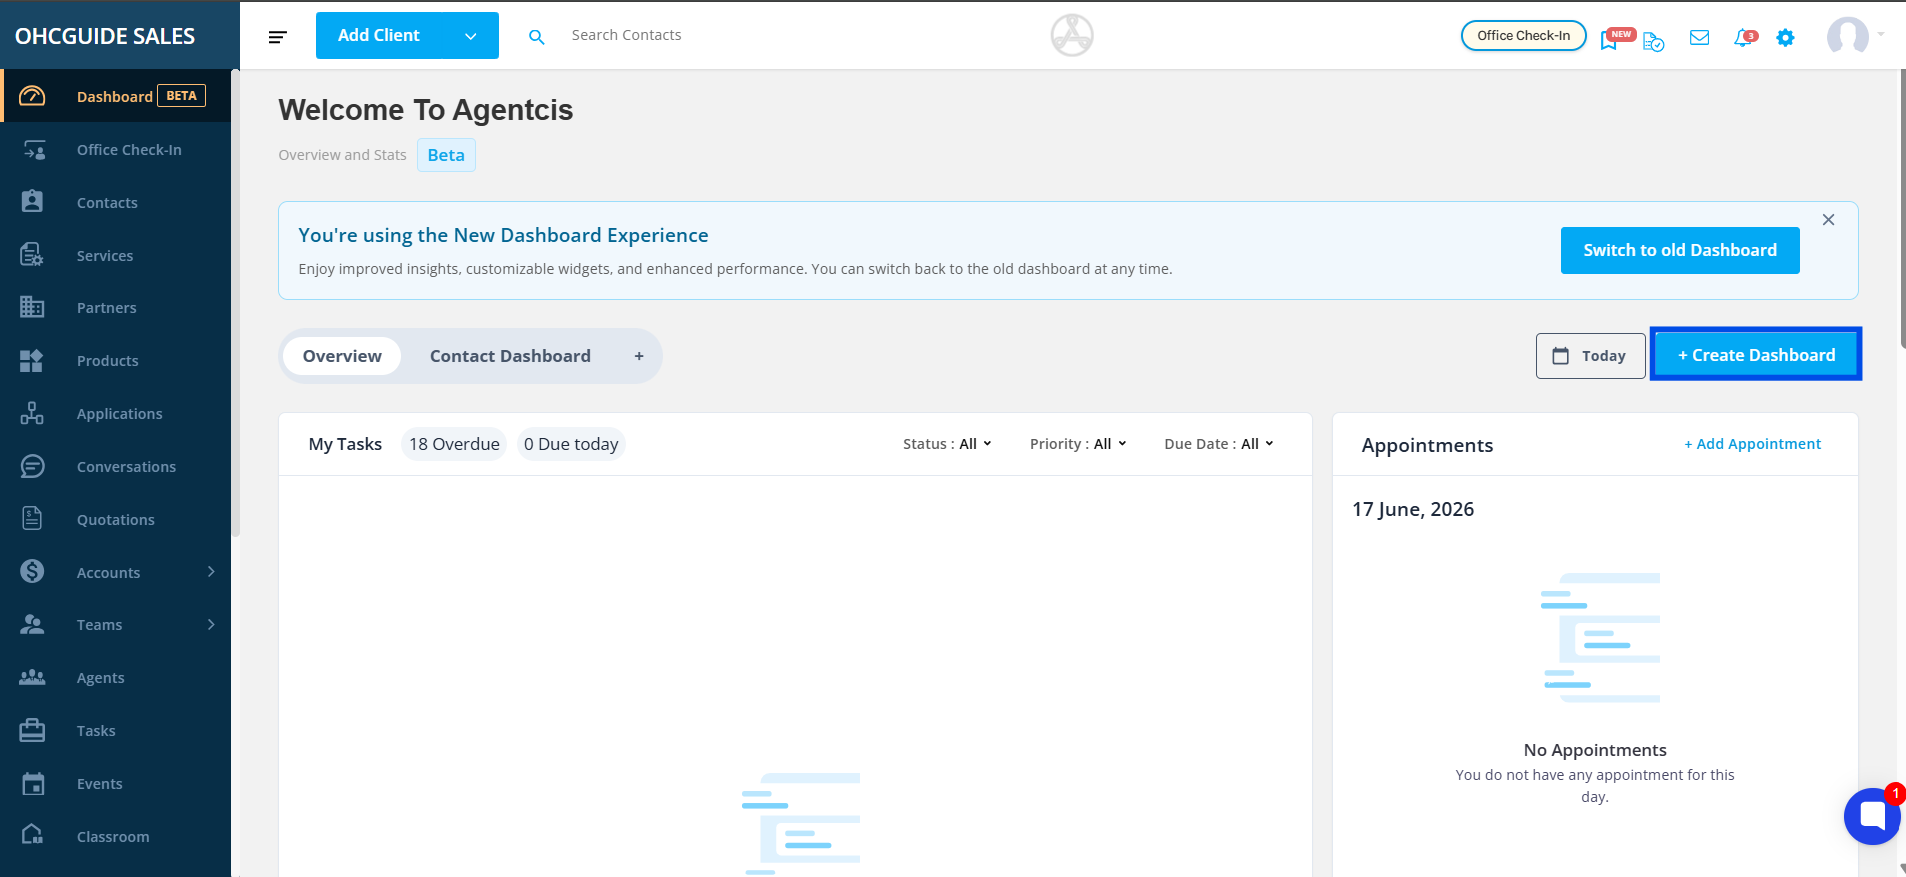
Click + Create Dashboard.
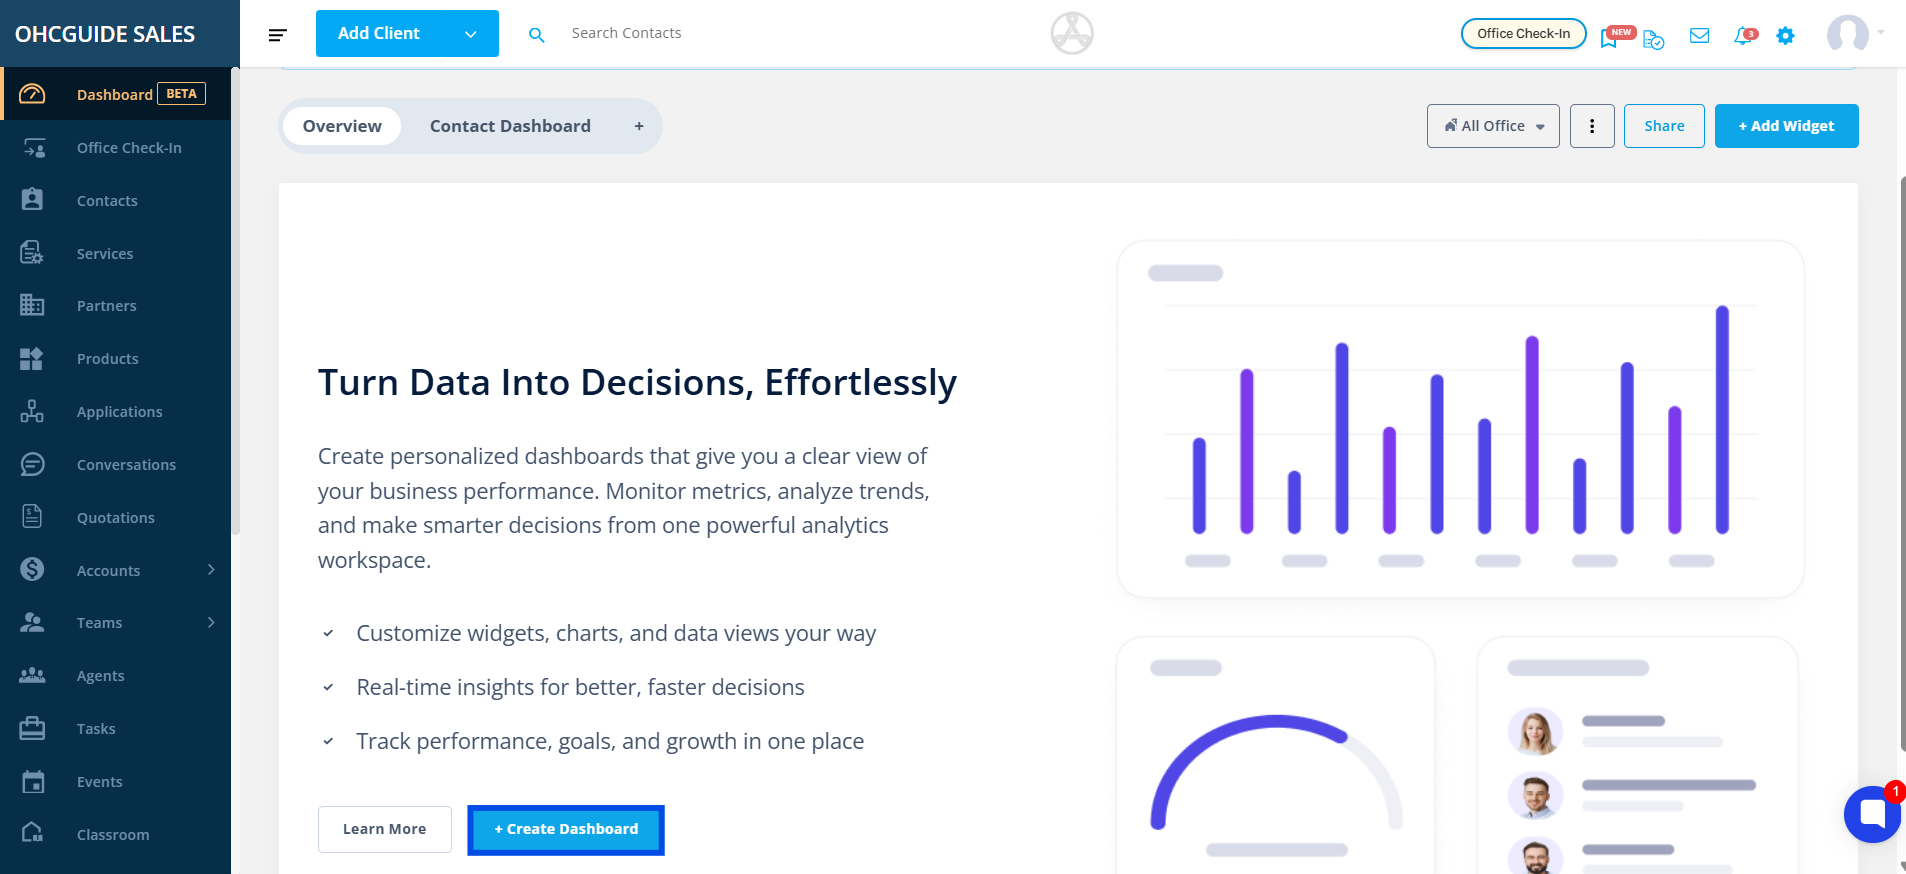
Then select, create dashboard.
Select Start from Scratch to create a new dashboard from the beginning, or choose one of the available templates to get started quickly.
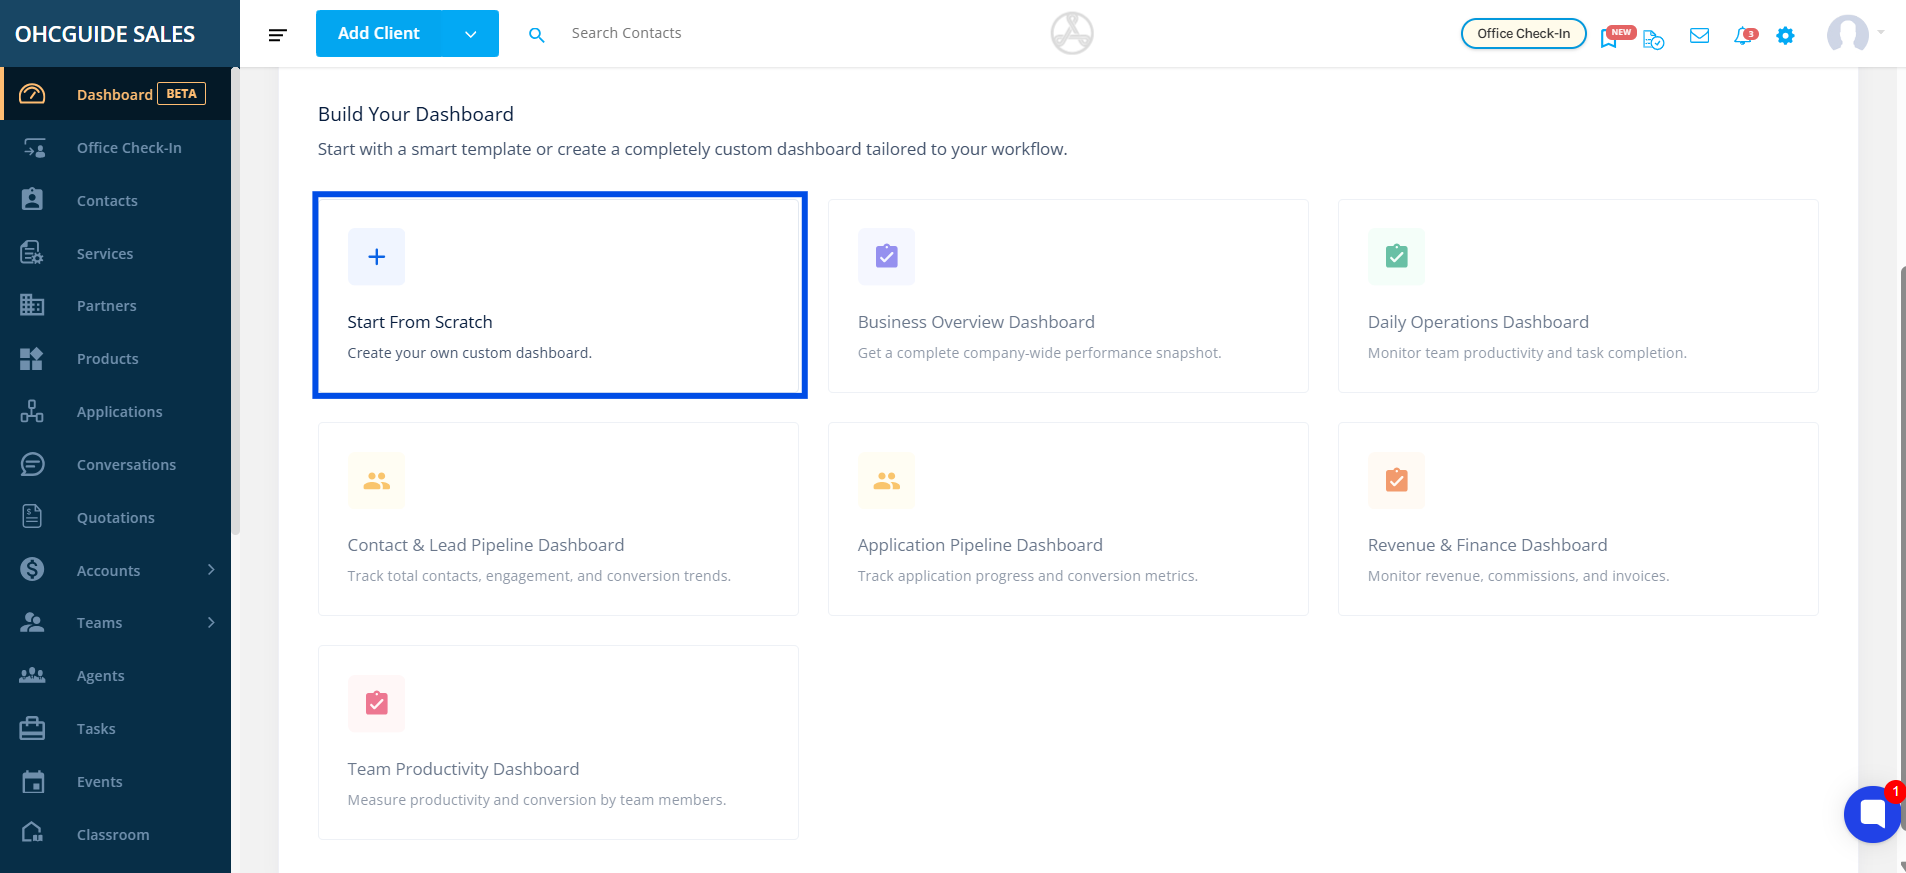
Note: Additional dashboard templates will be available in upcoming releases. Stay tuned for future updates.
Click Add Widget.
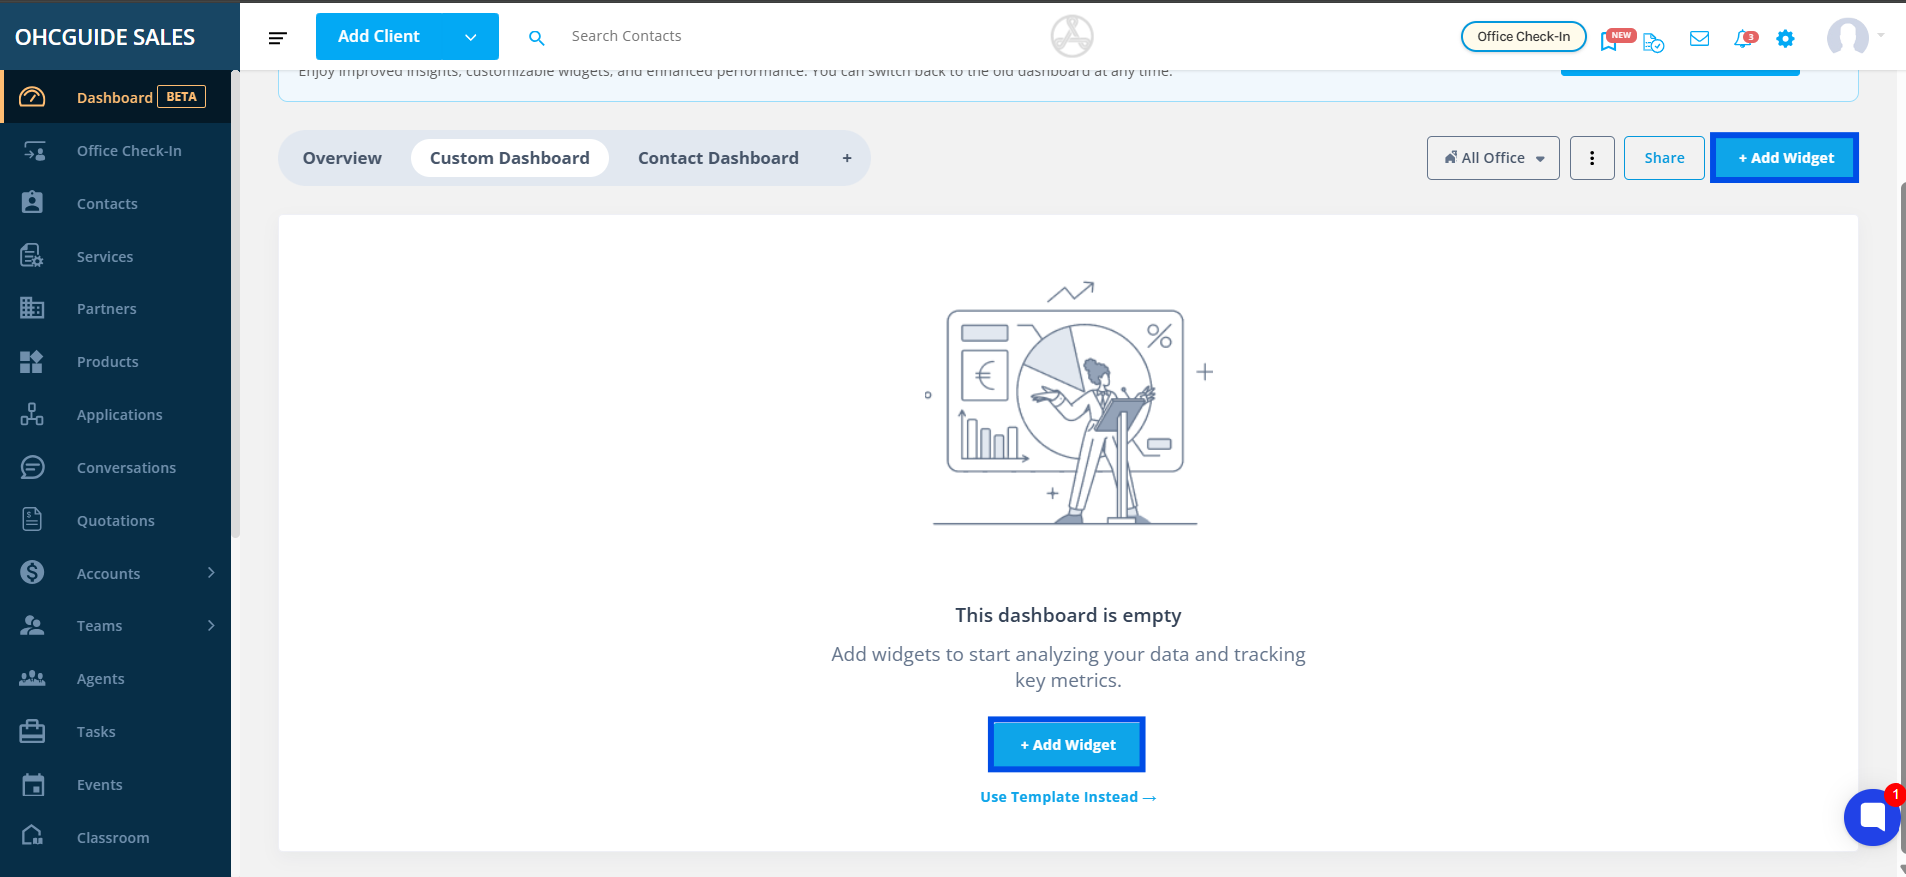
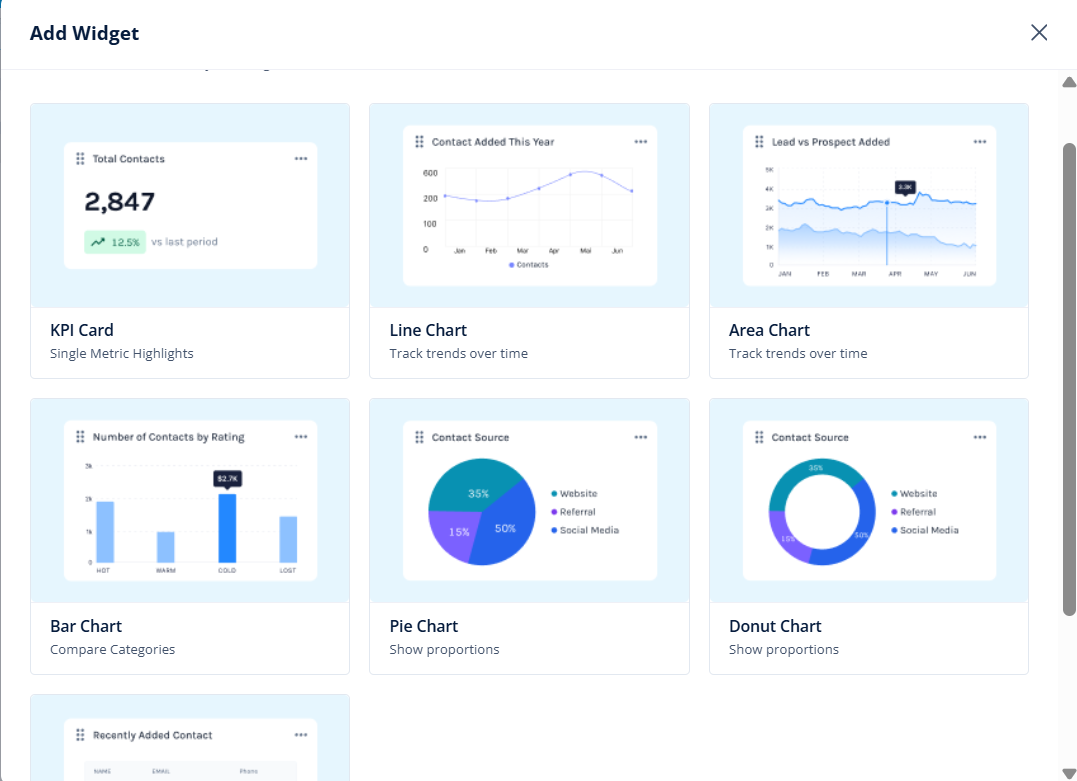
Select a chart type.
Choose a dataset.

Save the widget.

The widget will automatically be added to your dashboard.
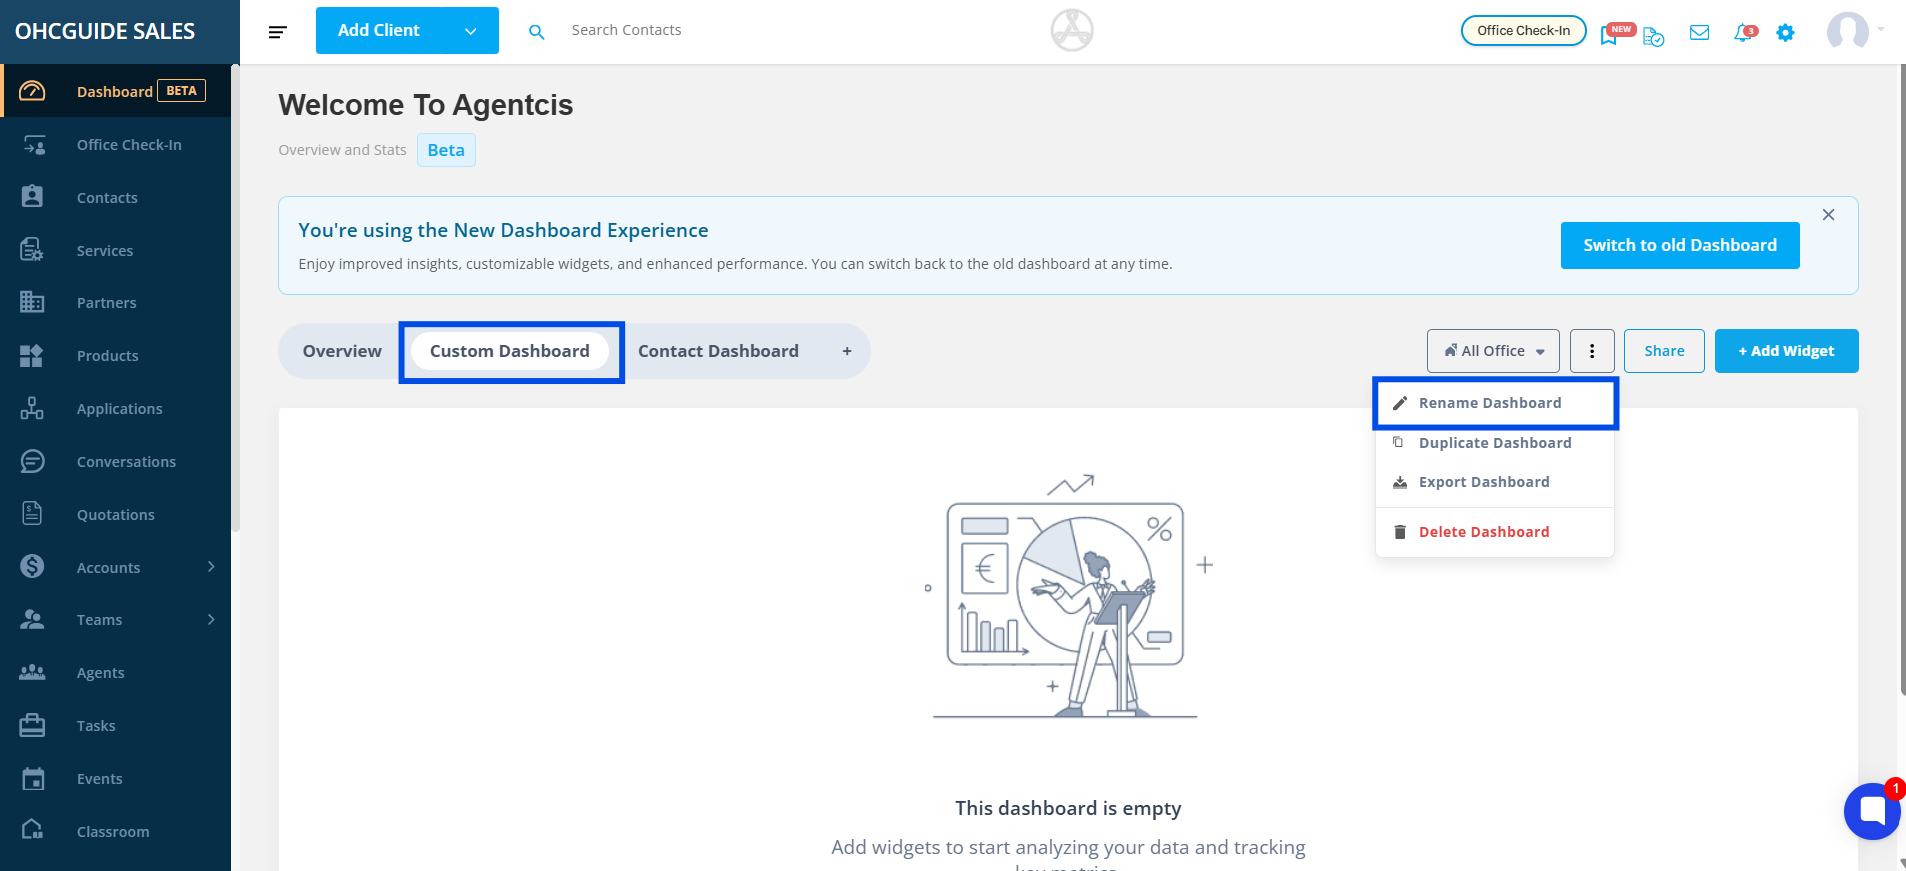
To rename a dashboard, either double-click the dashboard name and enter the new name, or click the three-dot menu and select Rename. Once updated, the new dashboard name will be saved automatically.
You can visualize data using the following widget types:
KPI Card
Bar Chart
Line Chart
Area Chart
Pie Chart
Donut Chart
Table
Choose the chart type that best represents your data and reporting requirements.