Agentcis dashboards provide interactive analytics tools that allow users to explore data, apply filters, export reports, and share dashboards with colleagues.
Global Office Filter: The Office Filter applies to all widgets on the dashboard and allows users to focus on data from specific offices. Users with access to multiple offices can switch between locations to analyze performance.

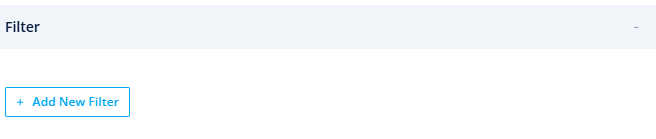
Widget-Level Filters: Individual widgets can have their own filter settings independent of the global office filter.
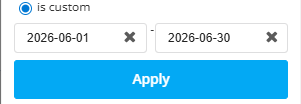
Date Range Filters: Widgets can be configured to display information for a specific date range, helping users analyze performance over different periods.
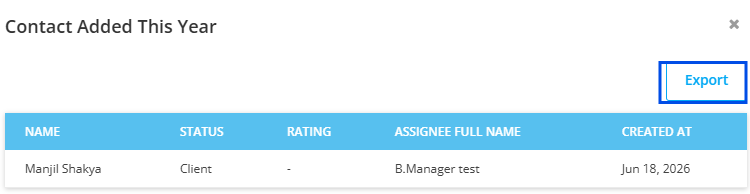
Drill-Down Analytics: Dashboards support interactive drill-down reporting. Clicking a KPI card or chart element displays the records behind the selected metric.
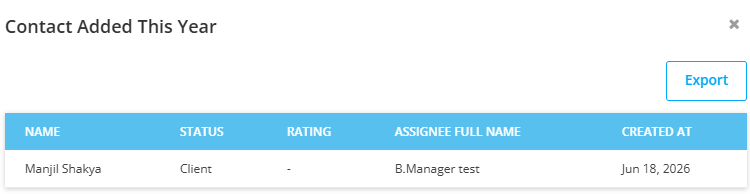
Examples include:
Applications contributing to a completion rate.
Contacts included in a conversion report.
Tasks affecting productivity metrics.
Users with export permissions can export dashboards for reporting and presentation purposes.
PDF Export: Generate a printable version of the dashboard layout.
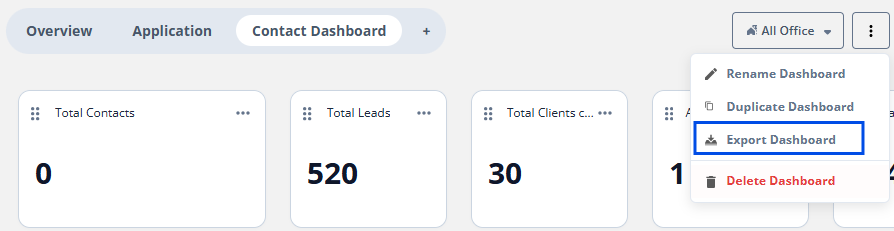
Excel Export: Export detailed records for further analysis.
Premium users can share dashboards with other users within the organization. Shared dashboards provide view-only access and maintain consistent reporting across teams.
Note: Only owner will be able to share the dashboard.
Dashboard View: Allows users to view dashboards that they own or have been shared with them.
Dashboard Manage: Allows users to create, edit, duplicate, and delete dashboards.
Dashboard Export: Allows users to export dashboard data and reports.
Dashboard Delete: Allows users to delete the dashboard.